
The player the model noticed first
The club, players and figures in this scenario are fictional.
It is late October, and a mid-table club is planning for the summer. The head coach wants a central midfielder who can receive under pressure, carry the ball through the first line of a press and still cover ground when possession is lost. The scouting department has produced a shortlist of five: established names from comparable leagues, players the scouts have watched live several times and whose agents are already familiar to the sporting director.
Then the analytics team adds a sixth. Their model, which compares midfielders across dozens of competitions, has flagged a 21-year-old playing for a modest side in a smaller European league. His numbers for progressive passes and ball recoveries are higher than any player on the existing shortlist. No major club appears to be tracking him. He costs a fraction of the alternatives.
The room divides. To one side, this is exactly why the club invested in data: to find the player everyone else has missed. To the other, the numbers look too good to be true. Does he play in a team that dominates the ball against weak opposition? Is his role inflating his statistics? How many minutes has he actually played? Can he cope with the speed, physicality and scrutiny of a stronger league?
Both instincts are reasonable. The model may have found overlooked talent. It may equally have mistaken context for quality. That tension — between statistical discovery and human interpretation — runs through modern football recruitment, and resolving it is far harder than the familiar story of algorithms replacing scouts suggests.

How football scouting actually works
Recruitment begins long before anyone opens a spreadsheet. A well-run club starts from squad requirements: which positions need strengthening, which contracts are expiring, which academy players are close to the first team, and what kind of player fits the head coach's tactical model. Budgets — for transfer fees and wages — narrow the field further. So does long-term planning: a club building around a young core may prioritise players who will improve, while one fighting relegation needs immediate reliability.
Within those constraints, scouts assess players through several lenses. Live match observation remains central because it reveals what cameras often miss: movement off the ball, communication, body language, positioning when play is on the other side of the pitch, and how a player responds to mistakes. Video scouting allows scouts to review far more matches than they could ever attend and to isolate specific situations. Tactical assessment asks how a player functions within a system: what he is asked to do, how well he does it, and whether those tasks resemble the ones he would face at the new club. Physical profiling considers speed, endurance, strength and injury history. And character and adaptability — professionalism, coachability, the ability to settle in a new country or dressing room — are assessed through conversations, references and background research.
The key principle is role-specific evaluation. Clubs are not searching for "good players" in the abstract; they are searching for a player who can perform a particular job in a particular team. A deep-lying playmaker, a box-to-box midfielder and a defensive screen may all be listed as central midfielders, yet their tasks, and the qualities that matter, are quite different. A technically gifted player may be the wrong signing if his strengths are not the ones the role requires.
The data revolution in football
Football's analytical infrastructure has grown in layers. The first is event data: structured records of on-ball actions — passes, shots, tackles, interceptions, ball recoveries, dribbles — each tagged with a time, a location on the pitch and attributes such as body part or outcome. Commercial providers such as Opta, part of Stats Perform, and StatsBomb, acquired by the sports technology company Hudl in 2024, collect event data across large numbers of competitions, combining human tagging with automated tools. StatsBomb's data introduced additional context, such as the positions of defenders and the goalkeeper at the moment of each shot. Hudl's Wyscout, acquired in 2019, built a widely used library of match video and data for scouting.
The second layer is tracking data: the positions of every player and the ball, recorded many times per second. In-stadium optical systems capture this in top leagues; broadcast-based tracking, offered by companies such as SkillCorner, estimates positions from television footage, extending coverage to competitions without stadium installations but with gaps whenever players are off-camera. Tracking data makes it possible to measure off-ball movement, spacing, pressing intensity and physical output — the parts of football event data largely misses.
The third layer is video, which remains the bridge between numbers and understanding. Most clubs use data to decide which video to watch, and video to decide what the data means.
Several issues complicate this picture. Data standardisation is imperfect: providers define and record events differently, so a "pressure" or a "key pass" in one dataset may not match another. Cross-league comparisons are hampered by uneven coverage and quality. Data availability varies enormously: elite leagues are covered in great detail, while many lower divisions, women's competitions and youth football have sparser data. And there is an important distinction between publicly available data — the statistics fans see on websites and broadcasts — and proprietary datasets that clubs license or build internally, which may include tracking data, custom event definitions and their own models.
The quantity of data does not determine its quality. A club with millions of events but inconsistent definitions, missing context or poor coverage of the leagues it scouts may be less well informed than one with fewer, better-understood data.
What expected goals can and cannot tell us
Expected goals (xG) is a model-based estimate of the probability that a given shot results in a goal, based on defined features of that shot. A shot assigned 0.15 xG is one that, according to the model, would be scored about 15% of the time by an average player in comparable circumstances.
The features vary between models but typically include shot location (distance from goal), shot angle, body part (foot or head), the type of assist (a cross, a through ball, a cut-back), and the shot context (open play, set piece, counter-attack). More sophisticated models incorporate defensive pressure and the positions of defenders and the goalkeeper, where the data allow. Because providers use different features, training data and methods, different xG models produce different numbers for the same shot, and they should not be treated as interchangeable.
The most common misunderstanding is to treat xG as a measure of what "should have happened". It is not. It is a probabilistic estimate of the average outcome of shots like this one. A team that wins 1–0 while being out-created on xG has not been "lucky" in any precise sense for that match; it has won a match in which, on average, teams producing those chances would often have lost.
For recruitment, xG and its relatives are most useful in aggregate. A forward who consistently takes high-value shots is probably getting into good positions. Comparing goals scored with xG over large samples may indicate finishing ability, but the relationship is noisy, and many players' over- or under-performance relative to xG regresses over time. Because most players take relatively few shots in a season, small samples can produce misleading conclusions.
xG also has limits as an individual metric. It values the shot, not the work that created it. It says little about players whose contribution lies in pressing, build-up or defensive positioning. And it reflects team context: a forward in a dominant attacking side will usually accumulate more xG than an equally good forward in a defensive one.
Expected assists (xA) extends the logic to chance creation, but its definition varies by provider. Some versions assign the xG of the resulting shot to the pass that preceded it; others estimate the probability that a pass becomes an assist regardless of whether a shot followed. The name is shared; the methodology is not.
Beyond goals and assists
Goals and assists are rare events, and most of what players do never directly produces either. Analysts have therefore developed metrics that try to capture the rest of the game.
Progressive passing and ball progression measure how often and how far a player moves the ball towards the opponent's goal, through passes or carries. Chance creation goes beyond assists to count passes that lead to shots, weighted or unweighted by shot quality. Defensive actions — tackles, interceptions, blocks, ball recoveries — describe activity without the ball, though raw counts are heavily influenced by how much time a team spends defending. Pressing metrics, derived from event data that records pressures or from tracking data, measure how often and how intensely a player closes down opponents.
Possession value models attempt a more unified view. Approaches such as expected threat and action-valuation frameworks developed in academic research estimate how much each action changes a team's probability of scoring or conceding in the near future, so that a pass from midfield into a dangerous zone can be credited even if no shot follows. These models are powerful but depend heavily on their assumptions, and different implementations can value the same action differently.
The hardest things to measure are off-ball movement and spatial occupation: the run that drags a defender out of position, the positioning that closes a passing lane, the decision not to press. Event data largely misses these, because nothing is recorded unless the ball is involved. Tracking data can capture them in principle, but turning positional data into reliable measures of tactical quality is an active and difficult research area.
The consequence is that different positions need different analytical frameworks. A centre-back may be valued for aerial duels, progressive passing and positioning; a full-back for crossing, overlapping runs and recovery speed; a striker for shot quality and movement in the box. Comparing a defensive midfielder and an attacking midfielder on the same dashboard of metrics is likely to mislead. Positional profiling — defining what a role requires before choosing metrics — is the precondition for any meaningful comparison.
How machine learning enters recruitment
Machine learning — statistical and computational methods that learn patterns from data — appears in recruitment in several forms, with very different levels of maturity.
Player clustering groups players with similar statistical profiles, often revealing roles that conventional position labels obscure. Player similarity models compare a target player with others based on selected measurable characteristics, helping recruiters find alternatives to an expensive or unavailable target. Both are widely discussed and relatively straightforward, but their results depend entirely on which metrics are included and how they are weighted.
Performance forecasting and development trajectories attempt to predict how a player's output will change with age or after a move to another league. These are much harder problems. Ageing curves estimated from historical data describe average patterns, not individual careers, and league-adjustment models rely on relatively small numbers of players who have moved between specific competitions.
Transfer valuation models estimate a player's market value from performance, age, contract length and other factors. They can be useful benchmarks, but market prices are shaped by negotiation, buyer urgency, agent influence and selling clubs' circumstances, which models capture poorly.
Injury-risk research is an area where caution is particularly important. Studies have examined relationships between training load, match congestion and injury, but injuries have many causes, and the evidence that models can reliably predict individual injuries is limited.
Tactical role matching and tactical analysis more broadly is where some of the most sophisticated published research sits. Google DeepMind and Liverpool, for example, published research in Nature Communications in 2024 on TacticAI, a system trained on more than 7,000 Premier League corner kicks that predicted outcomes and suggested adjustments to player positioning. In a blinded evaluation, Liverpool experts preferred the system's suggestions to real-world set-ups 90% of the time, though at publication the suggestions had not been tested on the pitch. It is a useful illustration of what current methods can do — in a narrow, well-structured situation with good tracking data — and of the distance between research and match-day use.
Publicly documented examples of clubs' internal recruitment models are rare, because clubs treat them as competitive assets. Liverpool's long-serving Director of Research, Ian Graham, has described the club's analytical approach in a book published after his departure in 2023, but detailed accounts of this kind are exceptions. Much of what is claimed about AI in recruitment comes from commercial providers, whose claims are difficult to verify independently.
All predictive modelling depends on training data, assumptions and validation. A model trained mainly on players from top leagues may perform poorly when applied to smaller ones. A model validated on historical data may fail when tactics change. And no algorithm can reliably predict an individual player's career, which depends on injuries, coaching, opportunity, personal circumstances and chance as much as on measurable talent.
A hypothetical scouting model
All players, leagues and values in this section are fictional and illustrative. They do not represent real players or real league averages.
Return to the club looking for a midfielder. Suppose the analytics team narrows the field to three candidates.
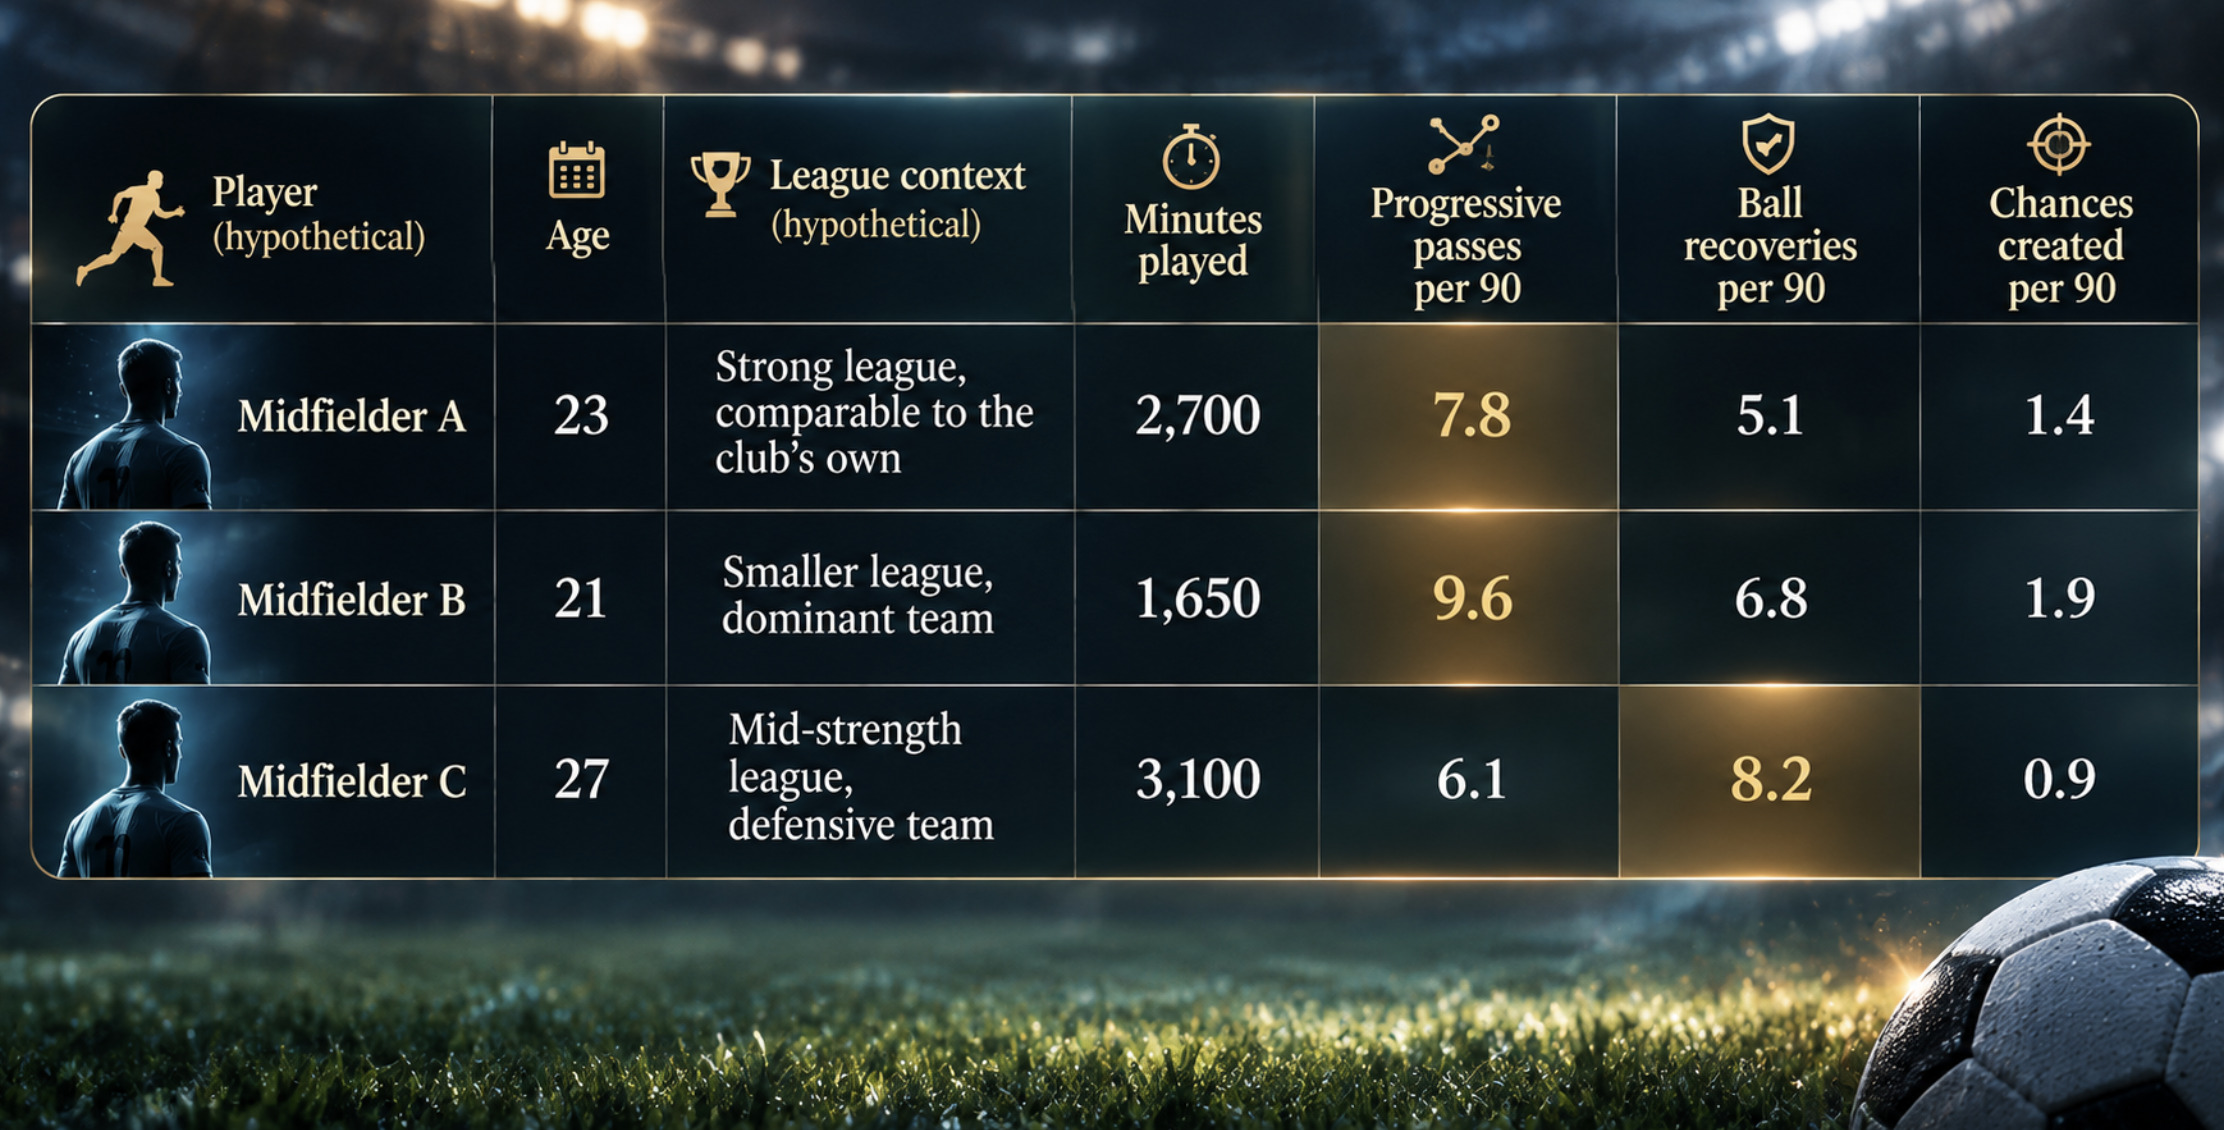
On raw numbers, Midfielder B looks outstanding. But the ranking depends on choices the model's designers make.
Metric selection and weighting. If the club wants a creative midfielder and scores players as progressive passes plus twice chances created, B leads (9.6 + 3.8 = 13.4), ahead of A (10.6) and C (7.9). If the club wants a ball-winner and scores ball recoveries plus half of progressive passes, B still leads narrowly (11.6), with C close behind (11.25) and A third (9.0).
League strength. Now suppose the club applies an illustrative league adjustment, scaling B's numbers by 0.80 and C's by 0.90 to reflect weaker competition, while leaving A's unchanged. The adjustment factors are invented for this example; real ones are estimated, uncertain and contested. Under the creative scoring, B's adjusted score (10.72) is now barely above A's (10.6). Under the ball-winning scoring, C moves ahead (about 10.13), B falls to second (about 9.28) and A remains third.
Positional role and tactical requirements. If the coach's system asks the midfielder to defend large spaces in transition, C's profile may suit best regardless of the composite score. If it asks him to break lines against deep defences, A's experience in a comparable league may matter more than B's higher output.
Sample size and age. B has played far fewer minutes, so his per-90 numbers are less reliable. He is also the youngest, which could mean upside, or simply more uncertainty.
The point is not that one player is correct. It is that the "best" candidate changes with modelling choices that are, ultimately, judgements about what the club needs. None of these scores predicts whether a transfer will succeed.
The context problem
The hypothetical example points to the most persistent limitation of data-driven recruitment: numbers are produced in a context, and context does not travel with the player.
League quality affects everything, from the time players have on the ball to the physical intensity of matches. Adjusting for it requires estimating league strength, which is itself uncertain. Team possession shapes opportunities: players in dominant sides make more passes and create more chances; players in defensive sides make more tackles and recoveries. Possession-adjusted metrics help, but only partly. Tactical systems define roles; a midfielder in a back three may face quite different demands from one in a single pivot.
Opponent strength and match state matter too: statistics accumulated while leading comfortably against weak opposition are not the same as those produced in tight matches against strong teams. Playing position may change during a season. Teammate influence is substantial: a midfielder's progressive passing depends on whether teammates make themselves available, and a striker's xG depends on the quality of service.
Sample size limits all of this. A season of league football provides a few thousand minutes at most, and many players accumulate far fewer. Metrics based on rare events — shots, goals, assists — are particularly unstable. And age and development add a further layer: young players' numbers can change quickly, in either direction, as they physically mature and gain experience.
The result is that a player producing strong numbers in one environment may not reproduce them in another. That is not a failure of the data; it is a reminder that data describe what happened, not what will happen somewhere else. Distinguishing correlation in historical data from genuine predictive power requires validation that many clubs, and most public analyses, cannot perform on adequate samples.
What the data cannot easily measure
Scouts often say that the most important qualities are the ones that do not show up in the numbers. That is partly true, but it is more accurate to say that some qualities are only partially observable in data, and difficult to assess reliably from it alone.
Tactical intelligence — understanding where to be, when to press, when to hold position — leaves traces in tracking data, such as positioning relative to teammates and opponents. But interpreting those traces requires knowing what the coach asked the player to do. Decision-making under pressure can be approximated by examining choices in particular situations, yet the alternatives a player had, and which were best, are rarely clear-cut.
Communication and leadership are largely invisible to event data. They may be glimpsed on video or in the stands, but they are best assessed through people who have worked with a player. Adaptability — to a new league, language, climate or coaching style — and social integration within a squad are among the most common reasons signings succeed or fail, and among the hardest to anticipate. Training habits, professionalism and psychological resilience after mistakes or criticism are observed mostly by coaches and staff, not by data providers.
None of this means that human assessment of these qualities is reliable either. Scouts' impressions are subject to their own biases: recency, reputation, appearance, familiarity. The honest position is that these characteristics matter, that data can sometimes offer partial evidence about them, and that both statistical and human assessments of them carry considerable uncertainty.
Bias in models and in youth development
Models inherit the biases of their data. Leagues with better data coverage are easier to evaluate, so players in poorly covered competitions may be systematically overlooked or misjudged. Historical recruitment decisions embed past preferences, so models trained on them may reproduce those preferences. And metrics designed around the men's elite game may transfer poorly to women's football or youth competitions, where data are often sparser.
Youth development is where these problems are most acute. Research on talent identification has repeatedly documented the relative age effect: in many youth systems, players born early in the selection year are over-represented, partly because physical maturity at a given age is mistaken for greater talent. Data that reward physical output in youth football can amplify this bias. Late developers, players whose strengths are technical or cognitive rather than physical, and those outside well-scouted regions are at risk of being filtered out early. Statistical talent identification at youth level is therefore especially uncertain, and especially consequential.
The economics of recruitment errors
A transfer is an investment under uncertainty, and the costs of getting it wrong extend well beyond the fee.
The transfer fee is often paid in instalments and amortised over the contract for accounting purposes. Wages, frequently the larger cost over a player's time at a club, are committed for the contract duration regardless of performance. An unsuccessful signing therefore imposes years of cost, and may be difficult to sell or loan without accepting a loss. There is also opportunity cost: money, wage budget and squad places spent on one player are unavailable for others, and a misjudged signing may block the development of an academy player.
Squad balance matters too: a statistically excellent signing who duplicates an existing profile adds less value than a weaker player who fills a gap. Resale value shapes the economics of clubs that rely on developing and selling players, which favours younger signings with room to improve — but younger players carry more development risk. And market uncertainty — changes in broadcast income, financial regulations, the strategies of competitors and the timing of the transfer window — affects what a player will eventually be worth.
This is why a model that identifies statistical talent is not necessarily a model that identifies good financial investments. The best performer on a scouting dashboard may be overpriced, unwilling to move, ill-suited to the league or too old to retain value. A modestly rated player with the right profile, contract and price may be the better signing. Player performance and transfer value are related, but they are not the same quantity, and recruitment decisions require both.
Why the best recruitment systems combine methods
The most credible accounts of data-driven recruitment, including those from people who have built club analytics departments, describe a process in which data and scouting inform each other rather than compete. A practical framework might follow ten steps.
Define the tactical role — what the player will be asked to do in the club's system.
Identify relevant performance indicators — metrics that genuinely reflect that role.
Evaluate data quality — coverage, consistency and reliability across the leagues being searched.
Build a candidate shortlist — using data to widen the search and filter efficiently.
Conduct video and live scouting — to test what the numbers suggest and see what they miss.
Examine contextual differences — league, team, role and opposition.
Assess physical and developmental factors — age, injury history, physical profile and trajectory.
Evaluate financial constraints — fee, wages, contract, resale and opportunity cost.
Review uncertainty — what the club does not know, and how much that matters.
Make a multidisciplinary decision — combining recruitment, analytics, coaching, medical and financial perspectives.
The strengths of each method are complementary. Data offer breadth, consistency and a check on human bias: they can survey hundreds of players across dozens of leagues and highlight candidates scouts would never have time to watch. Scouts offer depth, context and judgement: they can see whether the numbers reflect genuine ability, how a player behaves when things go wrong, and whether he is likely to fit. Each can correct the other's blind spots. Neither is sufficient alone.
The algorithm can find a player, but it cannot sign him
Return to the 21-year-old midfielder the model flagged. Perhaps the data were right: video confirms that he breaks lines with real quality, live scouting shows a player who demands the ball under pressure, and conversations with people around him suggest the maturity to handle a move. Perhaps they were misleading: his numbers turn out to be inflated by a dominant team, his minutes too few to trust, his profile poorly suited to the coach's system. Either way, the model has done something valuable. It has put a name on the table that would otherwise have remained invisible.
But identifying a statistical profile is only the beginning. Recruitment still requires understanding the context in which the numbers were produced, judging how a player will adapt to a different league, team and life, and weighing the price against the alternatives. Machine learning can widen the search, sharpen the questions and reduce some forms of bias; it can also introduce new ones and lend false confidence to uncertain conclusions.
The clubs that use data best are unlikely to be those that trust it most, or least. They are the ones that understand what their models measure, where those models fail, and how to combine statistical evidence with human expertise in a disciplined process. The algorithm can find a player. Deciding whether to sign him remains a human responsibility.