
A decade ago, a single number quietly changed how football is discussed. It started in analytics departments and betting models, crept into television graphics, and now sits on the screen next to the score of almost every major match. That number is expected goals — xG — and it has become the most influential and most argued-about statistic in the modern game. To its admirers it finally measures what actually happens in a match beyond the scoreline; to its critics it is a reductive number that strips the soul out of football. Both camps often talk past each other because they have never had xG explained clearly. So here is what it is, how it works, and what it can and cannot tell you.
What expected goals actually measures
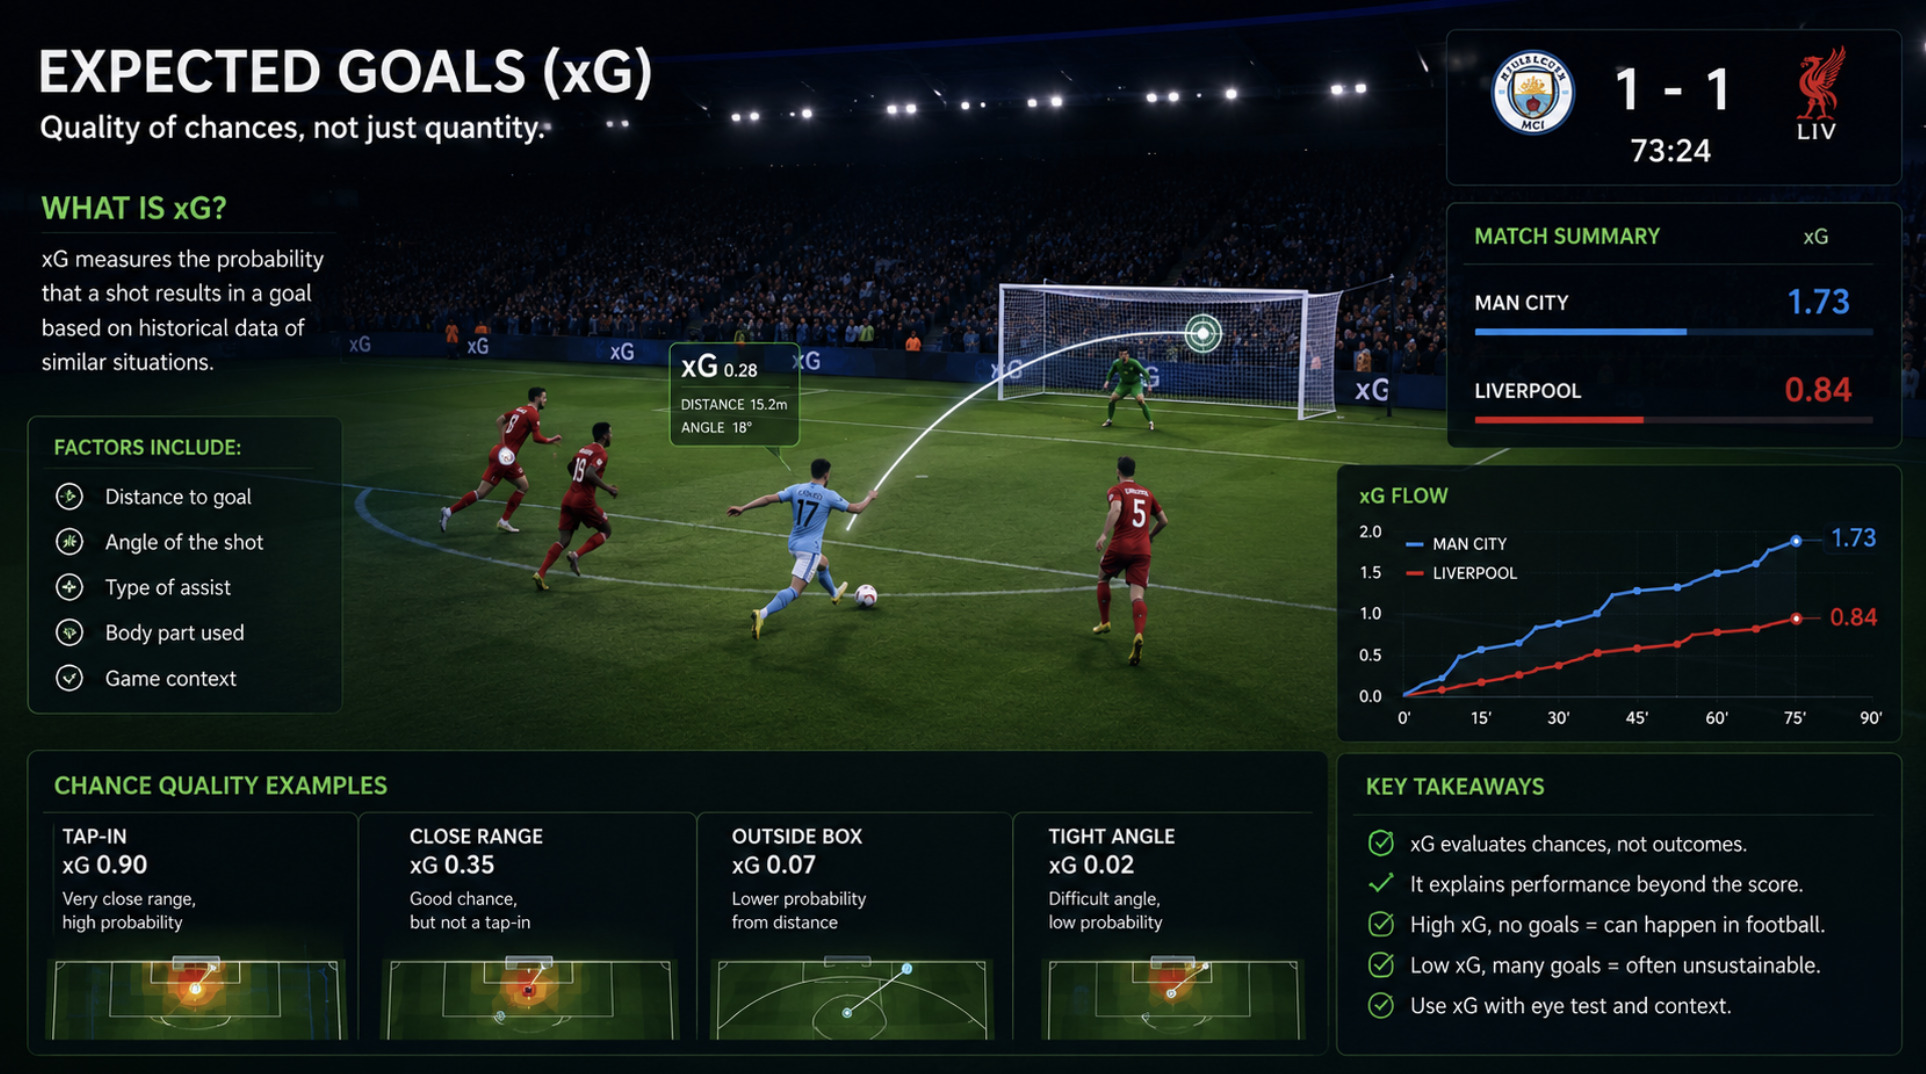
At its core, expected goals answers one deceptively simple question: how likely was a given shot to result in a goal? Every shot in a match is assigned a value between zero and one representing the probability that an average player would score from that situation. A tap-in from two yards might be worth 0.9 xG — nine times out of ten it goes in. A speculative effort from thirty yards might be worth 0.03 — it scores about three times in a hundred. Add up the xG of every shot a team takes in a match and you get their total expected goals: a measure of the quality and quantity of the chances they created.
That last phrase is the key to the whole idea. A team's xG describes the chances they generated, independent of whether the ball actually went in. A side might create 2.5 xG worth of chances and lose 1–0 to a single lucky goal; another might score three times from 0.8 xG of chances on a day when everything flew in. The scoreline records what happened; xG estimates what usually happens from those same situations. It is, in essence, a measure of chance quality rather than of outcome.
How the number is calculated
Expected goals is not a matter of opinion — it is produced by a statistical model trained on enormous quantities of historical shot data. The model learns, from hundreds of thousands of past shots, how often shots taken in particular circumstances were scored, and then applies that knowledge to each new shot. When a shot is taken, the model looks at the features of that situation and outputs the historical scoring rate for shots like it.
The factors that feed the model are the things that genuinely affect how likely a shot is to score. The most important is distance from goal and the angle to it — the single biggest driver of whether a chance is good. Beyond that, models weigh the body part used, since headers convert differently from feet; the type of pass that created the chance, as a cross or a through-ball sets up a different kind of shot; and whether it was a one-on-one, a header from a corner, a penalty, and so on. Each of these shifts the probability up or down based on what has historically happened from comparable situations. The output is not a judgement of how good the shot looked, but a data-driven estimate of how often that kind of chance is taken.
Why xG became so useful
The reason expected goals spread from analysts' spreadsheets to broadcast graphics is that it solves a real and old problem: football's scoreline is noisy. Goals are rare and heavily influenced by luck, individual moments and small margins, which means the result of a single match is an unreliable guide to which team actually played better. A team can dominate, create the better chances, and lose; a team can be outplayed and win. Over ninety minutes, the scoreboard often lies about the balance of the game.
Expected goals cuts through that noise by measuring the underlying process rather than the fortunate or unfortunate result. Because it is more stable than actual goals from match to match, it is a better predictor of future performance than the results themselves — a team consistently creating more xG than it concedes is usually better than its patchy results suggest, and tends to improve as luck evens out. This is why analysts, recruiters and betting markets embraced it: it separates how well a team is playing from how the dice happened to fall on a given afternoon. For a related look at how underlying numbers outlast short-term results, our piece on why the league table lies in the first ten games covers the same ground from the standings side.
What xG gets wrong, honestly
For all its usefulness, expected goals is not the objective truth its detractors accuse its fans of treating it as, and understanding its limits is as important as understanding its value. Because it is built on averages, it measures how likely an average player was to score a chance — which means it systematically undersells the very best finishers, who beat their xG consistently precisely because they are not average. Attributing a striker's overperformance purely to luck, when some of it is genuine skill, is one of the most common misuses of the stat.
There are other blind spots worth naming plainly. Standard xG values a shot but ignores much of what surrounds it — the position of the goalkeeper, the exact placement of defenders, the pressure on the shooter — because that information is harder to capture, though newer models increasingly try. It says nothing about the good chances that never became shots, or the defending that prevented them. And on the scale of a single match, small samples mean xG can diverge wildly from reality without either being wrong. It is a tool for describing tendencies over many games, and it is at its weakest when forced to explain one. Treated as a strong signal over a season and a weak one over ninety minutes, it is illuminating; treated as a verdict on a single result, it misleads.
Reading xG like an adult
The mature way to use expected goals is to hold both truths at once: it is the best single measure we have of chance quality and underlying performance, and it is an estimate with real limitations that should never be the only number you look at. Used as one lens among several — alongside watching the actual football, and alongside context the model cannot see — it makes analysis sharper and honest. Used as a hammer to declare who "deserved" to win, or to dismiss a great finisher as lucky, it becomes exactly the crude number its critics claim it is.
Expected goals did not ruin football and it did not solve it. It gave everyone who follows the game a better vocabulary for a question fans have always argued about — who was actually the better team — and like any good tool, it rewards those who understand what it measures and misleads those who expect it to measure everything. The next time xG appears next to the score, you will know precisely what it is claiming: not what happened, but what usually would.
Frequently asked questions
What does xG mean in football? xG stands for expected goals. It assigns every shot a value between 0 and 1 representing the probability that an average player would score from that situation. A team's total xG measures the quality and quantity of the chances they created, independent of whether those chances were actually scored.
How is expected goals calculated? A statistical model trained on hundreds of thousands of historical shots estimates how often shots taken in similar circumstances were scored. It weighs factors like distance and angle to goal, body part used, the type of chance, and how it was created, then outputs the historical scoring rate for that kind of shot.
Is xG a reliable stat? It is reliable as a measure of chance quality and underlying performance over many matches, and it predicts future results better than past results do. But it is built on averages, so it undersells elite finishers, ignores some context around a shot, and is unreliable for judging a single game.